Pistol Ballistic Comparison Chart
Pistol cartridges vary significantly in muzzle velocity, energy, bullet weight, and downrange performance. Standard factory offerings range from lightweight rimfire rounds designed for low recoil to high-pressure magnum cartridges built for heavy energy transfer. Comparing specific factory loads highlights how projectile mass, powder charge, and barrel length directly shape downrange terminal capability.
Table of Contents [Click to minimize]
Pistol Ballistic Comparison Chart
| Cartridge | Manufacturer and Load | Bullet Weight | Bullet Type | Test Barrel Length | Muzzle Velocity | Velocity at 25 Yards | Velocity at 50 Yards | Velocity at 100 Yards | Muzzle Energy | Energy at 25 Yards | Energy at 50 Yards | Energy at 100 Yards | Ballistic Coefficient |
| .22 LR | CCI Mini-Mag | 40 gr | CPRN | 6.0 in | 1,235 fps | 1,142 fps | 1,067 fps | 953 fps | 135 ft-lbs | 116 ft-lbs | 101 ft-lbs | 81 ft-lbs | 0.125 |
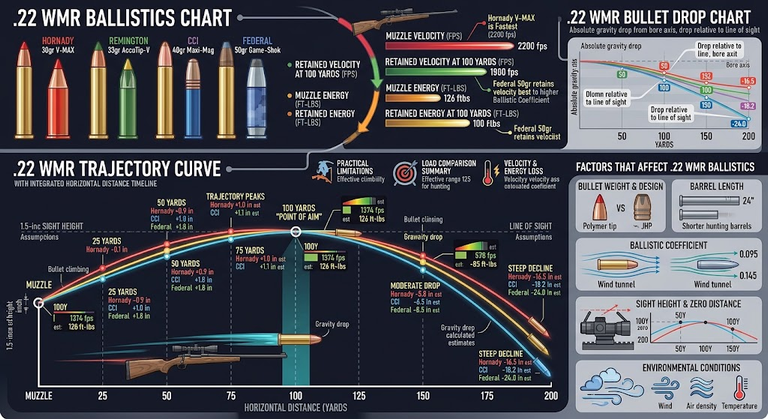
| .22 WMR | Hornady V-MAX | 30 gr | Polymer Tip | 1.87 in | 1,400 fps | 1,291 fps | 1,195 fps | 1,040 fps | 131 ft-lbs | 111 ft-lbs | 95 ft-lbs | 72 ft-lbs | 0.116 |
| .380 ACP | Hornady Critical Defense | 90 gr | FTX | 2.75 in | 1,000 fps | 953 fps | 912 fps | 839 fps | 200 ft-lbs | 181 ft-lbs | 166 ft-lbs | 141 ft-lbs | 0.090 |
| 9mm Luger | Federal HST | 124 gr | JHP | 4.0 in | 1,150 fps | 1,085 fps | 1,030 fps | 940 fps | 364 ft-lbs | 324 ft-lbs | 292 ft-lbs | 243 ft-lbs | 0.125 |
| .38 Special | Remington Express | 158 gr | LRN | 4.0 in | 755 fps | 733 fps | 712 fps | 672 fps | 200 ft-lbs | 188 ft-lbs | 178 ft-lbs | 158 ft-lbs | 0.155 |
| .357 Magnum | Federal American Eagle | 158 gr | JSP | 4.0 in | 1,240 fps | 1,162 fps | 1,095 fps | 988 fps | 539 ft-lbs | 474 ft-lbs | 421 ft-lbs | 342 ft-lbs | 0.160 |
| .40 S&W | Winchester Ranger T-Series | 180 gr | JHP | 4.0 in | 990 fps | 948 fps | 911 fps | 845 fps | 392 ft-lbs | 359 ft-lbs | 332 ft-lbs | 285 ft-lbs | 0.133 |
| 10mm Auto | Underwood Ammo | 180 gr | JHP | 5.0 in | 1,300 fps | 1,213 fps | 1,137 fps | 1,011 fps | 675 ft-lbs | 588 ft-lbs | 517 ft-lbs | 409 ft-lbs | 0.135 |
| .45 ACP | Speer Gold Dot | 230 gr | JHP | 4.0 in | 890 fps | 858 fps | 828 fps | 772 fps | 404 ft-lbs | 375 ft-lbs | 350 ft-lbs | 304 ft-lbs | 0.165 |
| .44 Magnum | Remington Express | 240 gr | SJHP | 4.0 in | 1,180 fps | 1,113 fps | 1,054 fps | 957 fps | 742 ft-lbs | 660 ft-lbs | 592 ft-lbs | 488 ft-lbs | 0.170 |
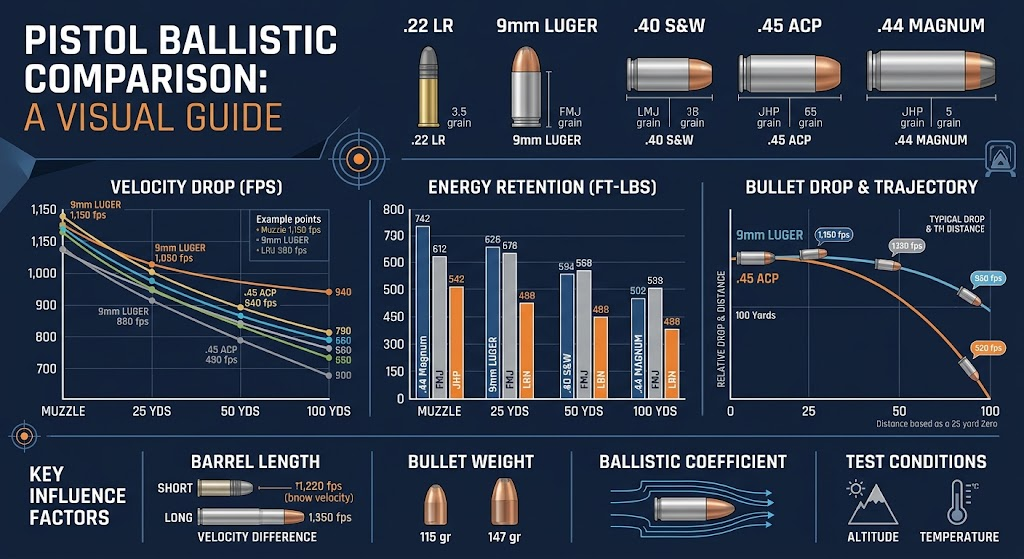
Statistical Overview of Pistol Ballistics
- Muzzle Velocity Range: The highest measured muzzle velocity in this specific group is 1,400 fps (.22 WMR Hornady 30 gr from a 1.87-inch barrel), while the lowest is 755 fps (.38 Special Remington 158 gr from a 4-inch barrel).
- Muzzle Energy Range: The highest verified muzzle energy is 742 ft-lbs (.44 Magnum Remington 240 gr), whereas the lowest is 131 ft-lbs (.22 WMR Hornady 30 gr).
- Bullet Weight Spread: Projectile weights span from a light 30 grains in .22 WMR up to 240 grains in .44 Magnum.
- Downrange Decay: Over a distance of 100 yards, velocity drops by roughly 15 percent to 25 percent across rounds, leading to total muzzle energy losses ranging between 30 percent and 40 percent.
- Test Environment Limits: Data points depend directly on specified test barrel lengths, which vary from 1.87 inches for compact revolvers to 5.0 inches for full-size semi-automatics.
Pistol Caliber Velocity Comparison Chart
| Cartridge | Bullet Weight | Manufacturer and Load | Test Barrel Length | Muzzle Velocity | Velocity at 25 Yards | Velocity at 50 Yards | Velocity at 100 Yards |
| .22 LR | 40 gr | CCI Mini-Mag | 6.0 in | 1,235 fps | 1,142 fps | 1,067 fps | 953 fps |
| .22 WMR | 30 gr | Hornady V-MAX | 1.87 in | 1,400 fps | 1,291 fps | 1,195 fps | 1,040 fps |
| .380 ACP | 90 gr | Hornady Critical Defense | 2.75 in | 1,000 fps | 953 fps | 912 fps | 839 fps |
| 9mm Luger | 124 gr | Federal HST | 4.0 in | 1,150 fps | 1,085 fps | 1,030 fps | 940 fps |
| .38 Special | 158 gr | Remington Express | 4.0 in | 755 fps | 733 fps | 712 fps | 672 fps |
| .357 Magnum | 158 gr | Federal American Eagle | 4.0 in | 1,240 fps | 1,162 fps | 1,095 fps | 988 fps |
| .40 S&W | 180 gr | Winchester Ranger T-Series | 4.0 in | 990 fps | 948 fps | 911 fps | 845 fps |
| 10mm Auto | 180 gr | Underwood Ammo | 5.0 in | 1,300 fps | 1,213 fps | 1,137 fps | 1,011 fps |
| .45 ACP | 230 gr | Speer Gold Dot | 4.0 in | 890 fps | 858 fps | 828 fps | 772 fps |
| .44 Magnum | 240 gr | Remington Express | 4.0 in | 1,180 fps | 1,113 fps | 1,054 fps | 957 fps |
Velocity Analysis Across Pistol Calibers
- Peak Velocity Performance: Lightweight high-pressure rounds like .22 WMR (1,400 fps) and 10mm Auto (1,300 fps) maintain the highest initial velocity numbers.
- Heavy-Subsonic Velocity Profile: Heavier full-size loads like the .45 ACP 230 gr (890 fps) start subsonically and lose velocity at a slower absolute rate in feet per second.
- Distance Degradation Rates: Bullets with higher ballistic coefficients retain velocity more effectively downrange, losing roughly 100 fps to 150 fps over 50 yards.
- Barrel Impact on Velocity: Short barrel configurations (e.g., 2.75-inch barrels on .380 ACP) severely restrict initial velocity acceleration compared to standard 4.0-inch test barrels.
Pistol Caliber Energy Comparison Chart
| Cartridge | Bullet Weight | Manufacturer and Load | Muzzle Velocity | Muzzle Energy | Energy at 25 Yards | Energy at 50 Yards | Energy at 100 Yards |
| .22 LR | 40 gr | CCI Mini-Mag | 1,235 fps | 135 ft-lbs | 116 ft-lbs | 101 ft-lbs | 81 ft-lbs |
| .22 WMR | 30 gr | Hornady V-MAX | 1,400 fps | 131 ft-lbs | 111 ft-lbs | 95 ft-lbs | 72 ft-lbs |
| .380 ACP | 90 gr | Hornady Critical Defense | 1,000 fps | 200 ft-lbs | 181 ft-lbs | 166 ft-lbs | 141 ft-lbs |
| 9mm Luger | 124 gr | Federal HST | 1,150 fps | 364 ft-lbs | 324 ft-lbs | 292 ft-lbs | 243 ft-lbs |
| .38 Special | 158 gr | Remington Express | 755 fps | 200 ft-lbs | 188 ft-lbs | 178 ft-lbs | 158 ft-lbs |
| .357 Magnum | 158 gr | Federal American Eagle | 1,240 fps | 539 ft-lbs | 474 ft-lbs | 421 ft-lbs | 342 ft-lbs |
| .40 S&W | 180 gr | Winchester Ranger T-Series | 990 fps | 392 ft-lbs | 359 ft-lbs | 332 ft-lbs | 285 ft-lbs |
| 10mm Auto | 180 gr | Underwood Ammo | 1,300 fps | 675 ft-lbs | 588 ft-lbs | 517 ft-lbs | 409 ft-lbs |
| .45 ACP | 230 gr | Speer Gold Dot | 890 fps | 404 ft-lbs | 375 ft-lbs | 350 ft-lbs | 304 ft-lbs |
| .44 Magnum | 240 gr | Remington Express | 1,180 fps | 742 ft-lbs | 660 ft-lbs | 592 ft-lbs | 488 ft-lbs |
Energy Transfer and Retained Power
- Maximum Kinetic Energy: Magnum and full-power auto loads (.44 Magnum at 742 ft-lbs and 10mm Auto at 675 ft-lbs) yield more than triple the muzzle energy of standard defensive compacts like .380 ACP (200 ft-lbs).
- Standard Service Calibers: Mid-range defensive rounds (9mm, .40 S&W, .45 ACP) cluster between 360 ft-lbs and 405 ft-lbs at the muzzle.
- Retained Downrange Energy: Heavy high-BC bullets retain kinetic force better at 100 yards; .45 ACP retains 75 percent of its muzzle energy, whereas .22 WMR retains only 55 percent.
- Energy vs Performance Limits: High muzzle energy does not automatically dictate terminal effectiveness, as terminal penetration and expansion rely heavily on projectile structural design.
Pistol Bullet Weight Comparison Chart
| Cartridge | Commonly Available Bullet Weights | Example Manufacturer and Load | Published Muzzle Velocity | Published Muzzle Energy | Notes |
| .22 LR | 32 gr – 40 gr | CCI Mini-Mag 40 gr CPRN | 1,235 fps | 135 ft-lbs | Rimfire round optimized for small game and plinking. |
| .22 WMR | 30 gr – 50 gr | Hornady V-MAX 30 gr | 1,400 fps | 131 ft-lbs | High-velocity rimfire optimized for varmint hunting. |
| .380 ACP | 85 gr – 100 gr | Hornady Critical Defense 90 gr FTX | 1,000 fps | 200 ft-lbs | Designed for subcompact personal defense firearms. |
| 9mm Luger | 115 gr – 147 gr | Federal HST 124 gr JHP | 1,150 fps | 364 ft-lbs | Standard NATO and defensive handgun cartridge. |
| .38 Special | 110 gr – 158 gr | Remington Express 158 gr LRN | 755 fps | 200 ft-lbs | Traditional revolver round with varied pressure loads. |
| .357 Magnum | 110 gr – 180 gr | Federal American Eagle 158 gr JSP | 1,240 fps | 539 ft-lbs | High-pressure revolver round with heavy kinetic output. |
| .40 S&W | 150 gr – 180 gr | Winchester Ranger T-Series 180 gr JHP | 990 fps | 392 ft-lbs | Medium-bore cartridge designed for duty handguns. |
| 10mm Auto | 135 gr – 220 gr | Underwood 180 gr JHP | 1,300 fps | 675 ft-lbs | High-velocity large-bore semi-automatic cartridge. |
| .45 ACP | 185 gr – 230 gr | Speer Gold Dot 230 gr JHP | 890 fps | 404 ft-lbs | Low-pressure large-diameter projectile with high momentum. |
| .44 Magnum | 180 gr – 300 gr | Remington Express 240 gr SJHP | 1,180 fps | 742 ft-lbs | Large-frame revolver cartridge used for hunting and defense. |
How Bullet Weight Shapes Ballistic Curves
- Inverse Weight-Velocity Relationship: Within any given caliber, lower bullet mass increases muzzle velocity, while heavier bullets trade velocity for momentum and barrier penetration.
- Momentum Maintenance: Heavy weights for caliber (e.g., 230 gr .45 ACP and 240 gr .44 Magnum) preserve downrange momentum and resist rapid deceleration.
- Pressure Limitations: Case volume dictates weight ceilings; compact cases like .380 ACP max out near 100 grains, whereas large revolver cases accept up to 300-grain projectiles.
Pistol Ballistics by Barrel Length
| Cartridge | Manufacturer and Load | Bullet Weight | Barrel Length | Muzzle Velocity | Difference From Reference Barrel | Test Conditions |
| 9mm Luger | Speer Gold Dot JHP | 124 gr | 3.1 in | 1,090 fps | -60 fps | Chronographed subcompact barrel |
| 9mm Luger | Speer Gold Dot JHP | 124 gr | 4.0 in | 1,150 fps | Reference | Standard service barrel test length |
| 9mm Luger | Speer Gold Dot JHP | 124 gr | 5.0 in | 1,195 fps | +45 fps | Full-size target barrel |
| .357 Magnum | Federal American Eagle JSP | 158 gr | 2.1 in | 1,100 fps | -140 fps | Snubnose revolver barrel test |
| .357 Magnum | Federal American Eagle JSP | 158 gr | 4.0 in | 1,240 fps | Reference | Standard revolver test barrel |
| .357 Magnum | Federal American Eagle JSP | 158 gr | 6.0 in | 1,350 fps | +110 fps | Long-barrel hunting revolver test |
Barrel Length Impact Analysis
- Velocity per Inch Gain: Handgun rounds generally gain or lose between 30 fps and 70 fps per inch of barrel added or removed.
- Magnum Powder Effects: Slow-burning powders in magnum rounds (.357 Magnum) show steeper velocity losses (up to 140 fps) when cut down to short snubnose barrels.
- Compact Auto Velocity Loss: Defensive rounds in subcompact barrels (e.g., 3.1-inch 9mm) yield lower velocities, which can affect terminal expansion thresholds of hollow-point projectiles.
Pistol Bullet Trajectory and Drop Comparison
| Cartridge | Manufacturer and Load | Bullet Weight | Distance | Trajectory Relative to Line of Sight | Remaining Velocity | Remaining Energy | Assumptions |
| 9mm Luger | Federal HST | 124 gr | 25 yds | +0.0 in | 1,085 fps | 324 ft-lbs | 25-yd zero, sight height 0.9 in |
| 9mm Luger | Federal HST | 124 gr | 50 yds | -2.3 in | 1,030 fps | 292 ft-lbs | 25-yd zero, sight height 0.9 in |
| 9mm Luger | Federal HST | 124 gr | 100 yds | -15.1 in | 940 fps | 243 ft-lbs | 25-yd zero, sight height 0.9 in |
| .45 ACP | Speer Gold Dot | 230 gr | 25 yds | +0.0 in | 858 fps | 375 ft-lbs | 25-yd zero, sight height 0.9 in |
| .45 ACP | Speer Gold Dot | 230 gr | 50 yds | -3.8 in | 828 fps | 350 ft-lbs | 25-yd zero, sight height 0.9 in |
| .45 ACP | Speer Gold Dot | 230 gr | 100 yds | -22.4 in | 772 fps | 304 ft-lbs | 25-yd zero, sight height 0.9 in |
Trajectory and Bullet Drop Insights
- Drop Variations at 100 Yards: Fast-moving 9mm bullets drop approximately 15.1 inches at 100 yards, compared to 22.4 inches of drop for heavier, slower .45 ACP rounds with identical zero distances.
- Short-Range Mid-Range Rise: With a 25-yard zero, typical pistol rounds maintain a flat trajectory between 0 and 25 yards with less than half an inch of vertical deviation.
- Impact of Velocity on Arc: Higher initial velocity flattens trajectory curves, reducing the need for vertical holdover adjustments at extended handgun distances.
Factors That Affect Pistol Ballistics
Cartridge Design and Operating Specifications: Maximum allowed chamber pressures established by SAAMI or CIP govern kinetic potential. High-pressure loads like 9mm (+P) or 10mm Auto operate at higher internal pressures than low-pressure rounds like .45 ACP, enabling higher velocities relative to case capacity.
Bullet Weight and Projectile Shape: Projectile weight directly shifts the balance between velocity and momentum. Aerodynamic bullet shapes like polymer-tipped or jacketed hollow-point designs maintain velocity longer than flat-nosed or round-nosed lead projectiles.
Barrel Length and Muzzle Velocity: Complete propellant combustion requires sufficient barrel length. Longer barrels allow expanding gas to push the bullet longer, yielding higher muzzle velocities before the bullet exits the muzzle.
Muzzle Energy and Retained Energy: Kinetic energy is proportional to mass and the square of velocity. Because velocity is squared in energy calculations, speed impacts muzzle energy values more significantly than projectile mass.
Ballistic Coefficient and Velocity Loss: Ballistic coefficient (BC) measures a bullet’s ability to overcome air resistance. Higher BC values slow air drag down, preserving downrange energy and flattening trajectory drop.
Test Barrel Differences: Manufacturers publish ballistics using standardized, sealed test barrels. Real-world handguns with shorter barrels, gas gaps in revolvers, or loose chamber tolerances typically register lower velocities than factory figures.
Sight Height, Zero Distance, and Environmental Conditions: Sight alignment above the bore line forces the bullet path to intersect the optic or iron sight line of sight at a given distance. Air temperature, altitude, humidity, and barometric pressure further alter real-world drag forces.
Frequently Asked Questions
1. What is a pistol ballistic comparison chart?
A pistol ballistic comparison chart is a empirical table that details key performance specifications—including bullet weight, velocity, energy, drop, and ballistic coefficient—across multiple handgun cartridges and loads.
2. Which common pistol cartridge has the highest muzzle velocity?
Among common loads compared, the .22 WMR (Hornady 30 gr at 1,400 fps) and 10mm Auto (Underwood 180 gr at 1,300 fps) exhibit the highest initial muzzle velocities.
3. Which pistol cartridge has the highest muzzle energy among the cartridges compared?
The .44 Magnum produces the highest overall muzzle energy in this comparison, generating 742 ft-lbs from a standard 240-grain factory load.
4. What is the difference between muzzle velocity and muzzle energy?
Muzzle velocity measures the speed of the projectile as it exits the barrel in feet per second (fps). Muzzle energy measures the total kinetic energy transferred by the bullet at the muzzle in foot-pounds (ft-lbs).
5. How does barrel length affect pistol ballistics?
Longer barrels allow propellant gases more time to push the bullet, resulting in higher muzzle velocities. Shorter barrels drop velocity, generally by 30 fps to 70 fps per inch lost.
6. How does bullet weight affect pistol performance?
Lighter bullets achieve higher muzzle velocities but lose velocity faster downrange. Heavier bullets travel slower initially but retain momentum and penetrate more consistently.
7. How quickly does pistol bullet velocity decrease with distance?
Most standard pistol bullets lose between 15 percent and 25 percent of their initial velocity by the time they reach 100 yards due to aerodynamic drag.
8. What is the difference between 9mm, .40 S&W, and .45 ACP ballistics?
The 9mm fires lighter bullets (115–147 gr) at higher speeds with moderate energy (364 ft-lbs). The .45 ACP uses heavy bullets (185–230 gr) subsonically with comparable energy (404 ft-lbs). The .40 S&W bridges both, pushing medium weights (150–180 gr) at moderate speeds (392 ft-lbs).
9. Why do ballistic charts show different results for the same cartridge?
Results vary due to differences in bullet weight, propellant blend, test barrel length, environmental temperature, altitude, and specific firearm tolerances.
10. Which factors should be considered when comparing pistol ammunition?
Key evaluation metrics include muzzle velocity, retained kinetic energy, bullet design type, trajectory drop, intended barrel length, and managed recoil.